Focus on Math

Helping children become mathematicians!

Calgary City Teachers’ Conf 2014 February 17, 2014

Screen shot 2014-02-17 at 9.04.21 AMIt was wonderful to share the Friday morning session at the Calgary City Teachers’ Conference with so many new friends! I hope you walked away with some ideas for helping your students understand mathematics is a deeper way. Congratulations to Shannon Muir who won the math coaching session in the draw!
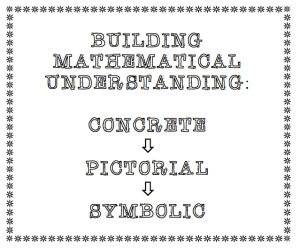
If you remember one idea from the morning, I hope it is one about building understanding in math. Students need to make sense of the concepts using first concrete materials, then with pictorial representations, and then with symbolic (or numeric) representation. Rules for manipulating numbers are not remembered well if they are not based in meaning. Caine and Caine report from their brain research, “The brain resists meaninglessness.”

As promised, I am posting here the tools we used and referred to for your easy access.

100 dot arrays (1 large)

100 dot arrays (6 per page)

100 dot arrays (12 per page)

ten frames (teacher size)

ten frames (mini blank ones, 40 per page)

base 10 grid paper (enlarge as needed)

fraction & percent circles

fraction pocket chart    (link here for more discussion about these)

I think that is everything. If I have missed something let me know. And I would love to hear how this all makes a difference for your students!

Mathematically yours,

Carollee

Screen shot 2014-02-17 at 11.27.57 AM


Wanted Posters Revisited February 4, 2014

wanted poster picDoing wanted posters for numbers is a great way to have kids think about specific properties of particular numbers. The posters make a great display, too —  and I am always looking for ideas for math bulletin boards!

The idea is useful at lots of grade levels. You could have older students choose a proper fraction (e.g., 5/8), a mixed number (e.g., 4 1/3), or a square or cube root (e.g. the square root of 50).I wrote about these posters before — click here for the link to the previous write-up where you can download the template.

Give them a try and send me a picture of your display!

Mathematically yours,

Carollee


Compatible Pairs for building Number Sense October 29, 2013

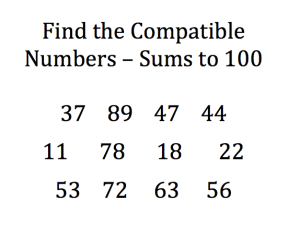
Compatible numbers picHere is an activity to use with elementary students of any age that helps build number sense. For any given grade level (or level of individual achievement) just choose a target that is appropriate for the student(s). It is great to do the activity on a repeating basis (i.e., once a week for a while) – just change out the pairs for the particular target each time.

Compatible Pairs: to 10. 50, 100, etc.                               Target: K-6
Write numbers on the chalkboard or prepare a transparency for the overhead. Include 5 or 6 pairs of numbers (mixed up in presentation) that will add to a target goal. Students write the numbers in compatible pairs as they see them.
When sharing the answers, ask students what strategies they used to find the pairs.
The difficulty of this exercise depends on the target sum as well as the similarity of the numbers given. Here are some suggestions for target numbers as well as some suggestions for number pairs.

Click here to download a chart with other some target numbers and some suggested sets of numbers.

I hope you will try this activity with your class soon!
Mathematically yours,
Carollee


Ten Uses for Sticky Notes in Math Class September 9, 2013

Sticky notes title pic Sticky notes (that wonderful — though accidental — invention that 3M first marketed as Post-It Notes©) are a wonderful tool to use in mathematics. I have always found that students enjoy using those little sticky pieces of paper! So here are ten ideas for incorporating them into math lessons:

1) Ordering numbers: Write 4 or 5 different numbers on sticky notes and have students work in pairs to put them in order from least to greatest. This is great practice for multi-digit numbers, for decimals, for fractions, etc.
2) Creating numbers: Write 4 or 5 different digits on sticky notes and have students work to create specific numbers: greatest possible; number closest to a particular given number (whole number or fraction); a number between two given numbers, etc.
3) Using operations: write several digits on sticky notes. Then use them and operations that the students know how to use to make number equations with as many different answers as possible or to get as close as possible to a particular answer.
4) Writing word problems: Give students numbers, operation signs, and possibly other math symbols (such at a percent sign) on sticky notes and have them create a word problem that uses all of the notes.
5) Graphing: Create the axis of a graph on chart paper or the chalkboard. Add your categories (4-6 work well). Give each student a sticky note and have them create a bar graph with then .(I usually have kids make their choice at their seats and write it on their notes so they don’t just add to a single category to make it “win”.) graph pic
6) Scavenger hunt: each student has a sticky note with math geometry word on it. Students must find an example in the room to represent the term and place the sticky note there (e.g., perpendicular lines, acute angle, sphere, etc.).
7) Measuring area: Cover a book or other object with sticky notes and calculate the area using the notes as the unit of measure. A particular book or surface may be covered by notes of one size, then by notes of another size and the area calculations compared.
8) Estimating on a number line: draw a number line on the board with only the endpoints marked (endpoints may vary according to grade: 0-10, 1-100, 0-1, 20-80, 1-1000, etc.). Give each student a number that appears on between the endpoints and have them come and place their number where they think it would go and explain their reasoning for placing it there.
9) Commenting on each other’s work: teach students to peer-evaluate problem solving work. Students can exchange their papers after working on an open-ended problem. The evaluator can make comments and ask questions regarding the strategies, visual representations, etc. by writing their comments on sticky notes.
10) Transformational geometry: Use sticky notes to show transformations, often called “flips”, “slides”, and “turns”. Light coloured sticky notes tend to be translucent. Using a sticky note, student can trace a shape from its original location on a grid and then use the sticky note to show the desired transformation (e.g., down two, left three; 90 degree clockwise rotation; reflection over a particular line).

I hope you try one or more of these in the next weeks. Let me know how it goes!
Mathematically yours,
Carollee


Math Camp 2013 Reflections… August 28, 2013

Screen shot 2013-08-27 at 7.13.49 PMWow! Math Camp 2013 was a resounding success! The focus each day was on how we can structure routine activities for our students that will allow them to build number sense. We also talked about Carol Dweck’s research about mindsets and looked at how we could help our students build a ‘growth mindse’t in mathematics and not be stuck in a ‘fixed mindset’. (If you have not read Dweck’s book Mindset, I encourage you to get a copy asap!)

We looked at visual routines, counting routines, and routines involving number quantity, and discussed how each of these can be utilized for learning.

Our visual routines involved using 10 frames, dot cards, dot plates, 100 dot arrays, fraction pocket charts, percent circles, base-10 grid paper, and number lines (I always have students draw these rather than use ones that are pre-drawn and pre-marked). See end of post to download the various tools.

Our counting routines involved choral counting, counting around the circle, and stop and start counting, and counting up and back.

Our routines for number quantity involved mental math, number strings, “hanging balances”, and decomposing numbers.

It would take too long to write here in one post about how best to use/do each of these ideas, but over time I will get to them. Are you interested in something in particular? Email me and let me know and I’ll get to that one right away!

All of the “math campers” went away with lots of ideas that can be implemented in the classroom right away. I’ll be excited to hear from them how it goes it their classrooms.

I’ll leave you with my favourite definition of number sense: “Number sense can be described as a good intuition about numbers and their relationships. It develops gradually as a result of exploring numbers, visualizing them in a variety of contexts, and relating them in ways that are not limited by traditional algorithms.” (Hilde Howden, Arithmetic Teacher, Feb., 1989, p.11).

There is much food for thought in that quote alone!

Mathematically yours,

Carollee

Click to download: student 10 frames , teacher 10 frames; student dot cardslarge 100 dot array, 12 small 100 dot arrays, 6 small 100 dot arrays, 4 small 100 dot arrays, teacher dot cards set 1, set 2, set 3; template for making dot platesbase-10 grid paper, percent circles; directions for making fraction pocket charts;


North Central Zone Conference Sessions March 9, 2012

Thanks to all of you who participated in my two math sessions here in Prince George, BC, today as part of the Zone Conference. In spite of my sore throat, we covered a lot of ground about fractions, decimals, percents, integers, and algebra.

I promised some “clean copies” of the handouts, so here they are, ready for downloading:
balance scale (for doing algebra equations concretely)
percent circles
percent grids and blanks (see activity below)
mini 10 frames (for representing decimal tenths in adding, multiplying, etc.) 27 per page40 per page

Remember, the BC curricular documents stress over and over that students should demonstrate their mathematical understanding “concretely, pictorially, and symbolically”. We tend to not do enough of the concrete and pictorial parts, but hopefully after today’s session(s) you have a few more ideas of how you can fit those in to your lessons.

We did not do anything with the percent grids and blanks, so let me share an  activity you can do with those. Before photocopying to give to students, partially shade several of the “blank” squares. Don’t worry about shading in a particular manner, just draw a random closed curve in each square and shade it in. Ask the students to estimate the percentage of the square that is shaded, and then give each of them one of the little 100 grids copied onto acetate and cut out individually. Students can lay the acetate grid over the partially shaded square and count the number of little grid squares that are completely shaded. Then have them count all the little squares that are partially shaded (for instance, the curve goes through the square leaving part of the grid square shaded and part not shaded) and divide by two to average out the ones mostly shaded and mostly not shaded.

For a recap on what we talked about using the fraction pocket charts, check out the blog post called “Reasoning About Fractions Using Benchmarks”. That post goes over what we talked about today and includes directions for making the pocket charts as well.

If I have forgotten something, let me know and I will edit this post and add to it! I hope you try something from the workshop right away with your students!

Mathematically yours,
Carollee


Reasoning About Fractions Using Benchmarks January 6, 2012

Filed under: General Math — Focus on Math @ 2:28 pm
Tags:

lg fr pocket chartI first came across the idea of using benchmarks with fractions in John Van de Walle’s book Elementary and Middle School Mathematics: Teaching Developmentally (Pearson). I loved Van de Walle’s idea that students could quickly compare any proper fraction to the benchmarks of 0, 1/2, and 1 and decide which value the fraction would be closest to, thus giving a quick estimation of the fraction. By actually placing the fraction on a number line showing 0 to 1, students have the opportunity to develop the understanding that every fraction has a particular place on the number line (though it might share the spot with other fractions). Students generally have had real life experiences with fractions such as 1/2, 1/4, and 3/4 and thus I have found that all students can be successful thinking about fractions in this way.

Given the fraction 15/16, it is clear that having 15 of the 16 parts means that it is nearly the full amount, and thus is close to 1. Similarly for 19/24. A student might say here that there are 9 pieces more than half, and only 5 pieces away from being the whole amount, thus 19/24 is close to 1. (A word of caution here — make sure that students give sound reasoning. In the example of 19/24 to allow a student to say “it is only missing 5 pieces so it is close to 1” is not sound, for 3/8 is also missing 5 pieces but is close to 1/2. It is the relative amount missing that is important. Similarly 123/1000 has many fractional parts, but because the number of parts there is small relative to the number of parts in the whole, this fraction is closer to 0.)

Non traditional reasoning can be used when benchmarking fractions such as 4/9. A student might think that since 4 1/2 is exactly one half of 9, 4/9 must be close to 1/2. Elementary and middle school students are not usually exposed to fractions within fractions, but this reasoning is mathematically sound and is useful.

Once students are comfortable benchmarking fractions, they can move on to comparing fractions. For most of us, our experiences with fractions were such that if asked to compare 3/10 to 11/15, we would have changed the denominators to the common multiple of 30 and then compared the fractions. However, using benchmarks it is east to see that 3/10 is less than 1/2 and 11/15 is greater than 1/2, thus making 11/15 greater than 3/10. There is much to be gained by taking the time to explore fractions using benchmarks.

I have created pocket charts to go along with this activity, a large one to be used at the front of the class as well as smaller individual ones students can use. Having done this with a number of classes, including recently with my grade 4 and grade 4/5 classes at Charlie Lake Elementary, I have found that students enjoy using the little pocket charts. One teacher, after I had made and used pocket charts with her class, emailed me later that day to tell me the students were begging to take the pocket charts home so they could show them to their parents! Seriously, when was the last time your class begged to go home and do fractions with their parents?

I explored this topic more fully in an article published in the Summer 2011 issue of Vector (the journal of the BC Association of Mathematics Teachers). That issue was a special elementary edition of Vector and was sent out to all public elementary schools in BC. If you are in the province, hopefully you have access to that article!

You can download directions for making the pocket chart in both sizes here.

I hope you try using fraction pocket charts with your students. Let me know how it goes!
Mathematically yours,
Carollee


Math Camp (gr 6-8) 2011 August 31, 2011

What a great group of participants we had at yesterday’s gr 6-8 math camp! I was delighted with all of the group sharing that we were able to facilitate — there is always so much that teachers can learn from each other.

The workshop yesterday focused on several things: mental math, integers, fractions, and algebra. These areas, I believe, are important for students to master if they are to be successful in subsequent levels of mathematics.

Mental math is a skill which is only developed if practiced, and we discussed some particularly useful strategies that might be incorporated into regular practice sessions. First, mental math begins with basic facts! From there we can have students practice thins such as these:

  • adding multiples of tens (MOT’s) (20 + 50)
  • subtracting single digits from MOT’s (50 – 8 )
  • adding single digits to non-MOT’s (39 + 6)
  • adding to get 100 or – from 100
  • adding any two-digit #’s (47 + 39)
  • doubling numbers
  • halving numbers
  • multiplying by 10, 100
  • dividing by 10, 100
  • multiplying by 20 (by doubling and then multiplying by 10)
  • multiplying by breaking up numbers (using “nice” numbers)

Response boards are a great way to do immediate full-class assessment during mental math practice.

Our focus on integers was in using “chips” to have students learn about positive and negative numbers in a very visual way. It is helpful for students if they understand the power of zero in adding and subtracting integers, and zeros can be visualized by an equal quantity of positive and negative chips. Using the chips to solve addition, subtraction, multiplication, and division problems involving integers allows students to build a conceptual understanding of integers which goes far beyond memorized rules.

For fractions, we discussed the need for students to develop number sense regarding them. Using benchmarks to estimate fractions is one way to help facilitate this. We talked about making pocket charts for both the teacher and the students to use in practicing this. (Pocket chart directions.)

As for algebra, once again, visualization was the key to helping students make sense of this generally abstract area. By having students display and manipulate equations in a concrete way on a “balance scale”, they have the opportunity to learn what are acceptable or “legal” moves in solving algebraic equations. (Balance scale.) A hands-on, visual approach to algebra allows every student to be successful in this area!

One of the teachers at the workshop is going to email me a rubric that she used in her math classes last year, and I will up-date this post with that rubric once I have received it. (later) Here is the link for the rubric. When we discussed this, the “traffic light” part was really important. Remember that students can self-assess their understanding and record it as red (“I am totally stuck.), yellow (“I am able to work some on the problem but not I am not really sure about it.), or green (“I understand this well enough that I could teach someone else.)

In the meantime, I hope you will think about how you might better teach these areas of mathematics that are critical for students in these grades.

Mathematically yours,
Carollee


Math Toolkits for Students — More Stuff to Add (part 3) May 19, 2011

There are more items that can be added to the toolkits for students, but these I will separate by primary (gr 1-3) and intermediate (gr 4-7) levels. Again, it is hard to just mention the contents without going into activities that use the tools to help students build mathematical understanding. Hopefully the tool itself will prompt you to think about some ways to use it.

Primary Tools:

  • 25 chart, laminated (usually created in 5 rows of 5)
  • blank 5-frame (with spaces big enough to put counters on)
  • blank 10-frame
  • blank double-10-frame (two blank 10-frames on one card)
  • set of filled in 10-frames (1-9, multiple 10’s)
  • bead bracelet (10 beads in two colours, 5 of each) to be worn draped over the fingers so the beads can be manipulated. Two bracelet may be worn to use for numbers in the teens.
  • large flattened paper plate or cut out paper circle for making dot plate configurations with bingo chips
  • mini bags of small coloured wooden sticks or other small materials for patterning
  • teeny-tiny Hundreds Tens and Ones (HTO’s) — miniature place value pieces cut out of large plastic canvas (found in crafting stores)
  • place value cards — overlapping cards that show, for example, 425 can be pulled apart to reveal 400, 20 and 5 (click on image above to print)

Intermediate Tools:

  • booklet of mini 100 charts to be coloured in to show multiples (x2, x3, x4, etc.)
  • metre tape (purchased or created by taping photocopied paper lengths together)
  • fraction-bar card (a card with a fraction bar in the middle — students use numeral cards to place as the numerator and denominator)
  • fraction percent circles (two different coloured circles partitioned off in hundredths each cut along one radius and then placed together so they “spin” over each other to show different percent values)

As you can see, there are many things that can be used as “tools” in the teaching of mathematics. Creating a toolkit with students is a wonderful way to make lessons engaging.

Mathematically yours,
Carollee


Fraction Question for “Thirds” May 12, 2011

First, let me say what a wonderful year of collaboration it has been with the teachers from Alwin Holland Elementary School. Thank you, ladies, for your hard work in mathematics this year. We all came away having more informed than we were about mathematics education.

Part of our last day together was spent in two different classroom where I did demonstration lessons. In the grade one classroom I demonstrated the teaching of the +9 addition strategy (as learned in the basic facts addition blog) using 10-frames.

In the grade 2/3 split classroom, the teacher was interested in a fraction lesson that centered around problem solving.

I started the lesson by talking about a class which was made up of 1/2 boys. I asked the children if they thought the class had only two students in it, one of which was a boy. They all agreed that, no, the class was larger than two, and they offered suggestions of how many might be in the class, and then how many of them would be boys. At one point I asked if they thought 23 might work for the class number, and they knew that being an odd number, it did not work to divide the class in half. I then presented this question that I had written for the lesson:
Marcie grabbed some bingo chips from a bag on the table. After sorting her chips, she told her friend that 1/3 (one-third) of them were red. What might her chips have looked like? Find as many different solutions as you can. Each solution should use a different number of chips altogether.

The students had bags of bingo chips to share in their table groups, and they used the chips to find a variety of solutions. All of the children were able to come up with some solutions, and a few of them realized they could keep adding one more chip to each of their sets to find more answers.

When we shared our solutions I put the information on a T-chart with one side labeled “number of red chips” and the other “total number of chips”. Students gave their answers in random order, and after we had quite a list, I suggested we look for a pattern. I made a new T-chart with the same headings, but we listed our answers in order of number of red chips: 1, 2, 3.. No one had given an solution with 7 red chips, but it was easily figured out by looking at the pattern that presented itself. The students recognized the pattern in the second column was “skip counting by threes”. Then I proposed some big numbers of red chips such as 20, 100, 1000 and they could answer the total number of chips to be 60, 300, and 3000 respectively. Finally we looked for the “n-rule”: for n number of red chips, how many chips altogether. At first students guessed other large numbers (500, a million, etc.), but finally one boy said “It would be n + n + n.”
It was the first look at the n-rule for the students, but the teachers were motivated to go back to some other patterns and play with that idea with children. Anytime we help kids move to that point, we are laying the foundation for algebraic thinking.

All in all it was a fabulous day! Thanks again to the collaboration group from Alwin Holland School!

Mathematically yours,
Carollee